Elasticsearch – Grafana graphs
- Running grafana for the ELK stack
OK, I have had a running elk stack for quite a while and a ton of information that is gathered from the server running in my network. I have not had the time to really dig into what I actually can. As many before me, or at least I hope so, I have been stuck in what I want to use it for. Well I want to see my logs for errors. Hmm okay but what kind of errors. The first real use landed on my table was when I had to present a current state of the business for the board. As I work for a small ISP, giving email service to a our customers an idea come to mind. Spam, spam is a problem and spam is really annoying. And as customers are allowed to choose to run pop3 or imap we cant just mark mails as spam and put them in the junk folder as outlook and mail.google does. And I still think it is annoying to get spam mails there. So over the months we have really worked to tight in our spam filtering abilities so why not show it.
Kibana that puts the K in ELK is nice use for discover things to look for but graphic wise it is damn ugly. Well it is before the v.5 and i may not just understand how to really use it yet.
How ever we have grafana running to graph our SAN storage performance and it puts out some nice graphs.
So This is a wrap up of how to config elasticsearch to allow grafana to use search in elasticsearchs index as a data source. There is some good guides how to get a ELK stack up and running nothing fance. But it can get someone started this one is excellent https://www.atlantic.net/community/howto/install-elk-stack-on-debian-8/
First – as default the setting “network.host” is set to 127.0.0.1 or localhost and is commentet out so uncomment it change it to fit the current environment.
Network.host can have severel settings and take a look at the options that is right for you.
I want my grafana server and localhost to have access to the elasticsearch so I change it
Have not figured out how to use a array here like network.host: [“127.0.0.1”, “grafana.bla.dk”] so
- network.host: 0.0.0.0
secondly edit or add the two following lines
- http.cors.allow-origin: “*”
- http.cors.enabled: true
If they do not exist in your config then just add them
Warning: Because Elasticsearch doesn’t have any built-in security, it is very important that you do not set this to any IP address that is accessible to any servers that you do not control or trust. Do not bind Elasticsearch to a public or shared private network IP address!
** Explanations on the values and how it is used **
Setting up grafana data source
Choose menu > Data sources > +Add new data source
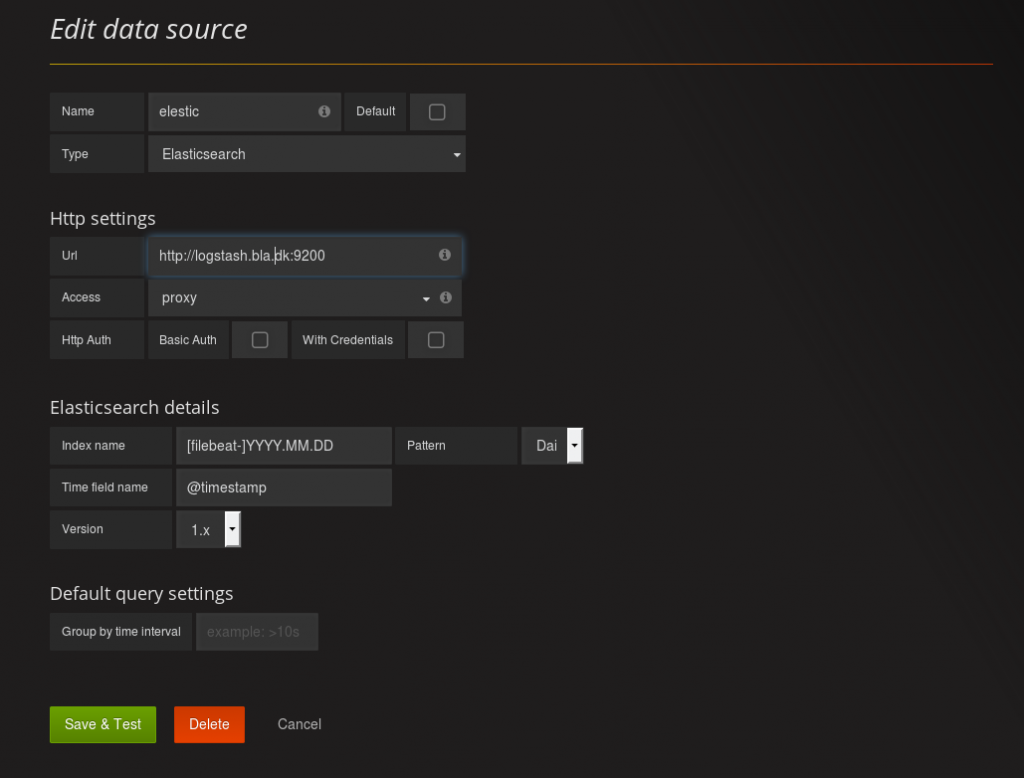
Give it a good name so separate the different data sources
Choose type as Elasticsarch
Fill in the URL to the elasticsearch server. In this case it is call logstash and access as proxy
Im using filebeat to transport my log from server to logstash that is way the index is as it is.
Im configured the elasticsearch in the elasticsearch.yml file to save data at /data/elastic/elasticsearch/nodes/0/indices/ so look for path in yml file for option parh.data.
In the folder it is possible to see the syntax of the index name for file beat. – in my exemple it is e.g filebeat-2017-05-18. It is a folder not a file
The timefield name
Go to the /etc/logstash/ and read the filter conf file for the name. I have set up a syslog file and focusing on the timestamp identical. It makes it easier when searching with elasticsearch.
So
filter {
if [type] == ‘syslog’ {
grok {
match => { ‘message’ => ‘%{SYSLOGTIMESTAMP:syslog_timestamp} %{SYSLOGHOST:syslog_hostname} %{DATA:syslog_program}(?:\[%{POSINT:syslog_pid}\])?: %{GREEDYDATA:syslog_message}’ }
add_field => [ ‘received_at’, ‘%{@timestamp}’ ]
add_field => [ ‘received_from’, ‘%{host}’ ]
}
syslog_pri { }
date {
match => [ ‘syslog_timestamp’, ‘MMM d HH:mm:ss’, ‘MMM dd HH:mm:ss’ ]
}
}
}
Now save & test
If all goes well it will be green and not prompt an error
Kibana to create search string
Log in to kibana and go to the discovery pane.
Kibana is using Lucene Query syntax for creating search queries. For search tip look her. (opens in new window) I want to find how many mail our MX servers have rejected from outside our network. It quite easy, oh well if you know what your are looking for, it is. So when receiving mails the MX servers go through a filtering to check to spam, virus and other checks to keep spam as low as possible. Firstly the mx server will do a postscreen check. The check contains a pregeet check that check if the sending SMTP server sends before it is allowd, and a RBL checks, this one do a dns lookup to spamhouse to see if it is listes. The logs gives it a rank of dnsbl 1 or dnsbl 2. So searhing for dnsbl will finde both in kibana and all hits in logs are showend. When confirmed it can be used in grafana. Same syntax as Kibana apply here.
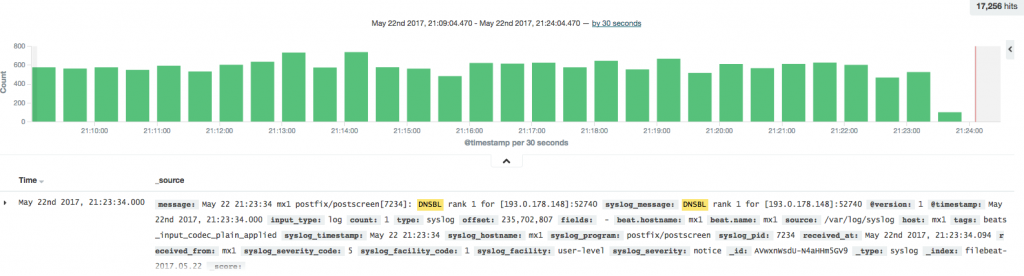
This is a very small piece of a log from a MX server. To find this I have search entered in the search field ‘*dnsbl’ . This search give 2 hits per log entry. and when I want to count how many spam blocks we daily will this give me a lot of false positives .
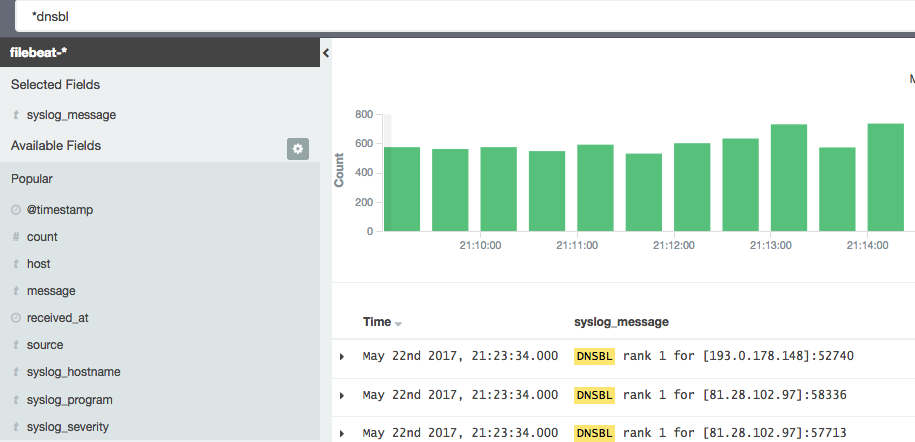 A good trick is to select search fields to narrow down it down. In this example I have the syslog message.
And the result can be used to visualize the amount of DNSBL we do in ever giving period. Save the search with a name that describe what the search do.
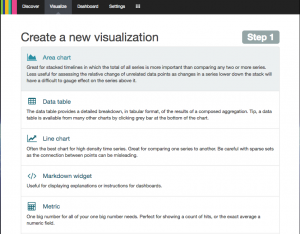
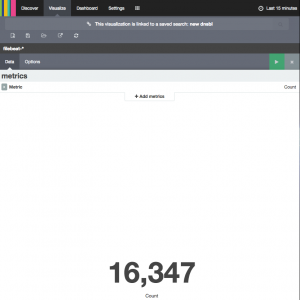
Choose the visualization tool to get the infomation to desire. I just what a number, a counter and that give a fast overview.
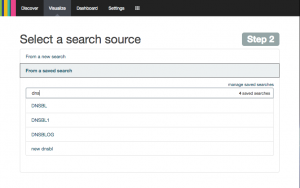
Next pick “From a saved search” and pick the saved search from before. And that is why it is importent to give the search a good name for what is does.
And there you have it. 16.347 hit in the last 15 mins. We try to do our best to battle spam. And we have become quite good at it.
Graphs in grafana
It is almot the same we will do here as in the kibana setup.
Entries graph
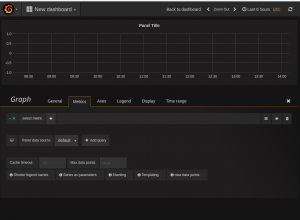
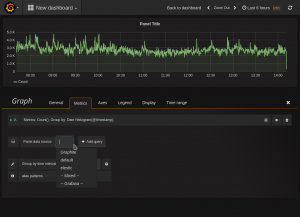
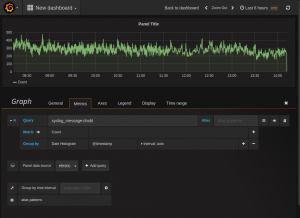
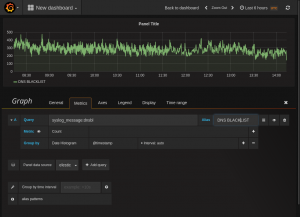
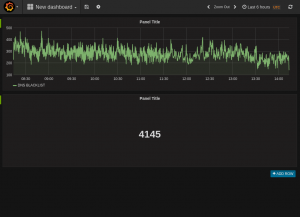
First we create a graph to our dashboard. In the dashboard hit the green field in the right side of the row you would like to add the graph and select “Add panel and the graph. It will select the default data source and in my case it is a graphite data source . Select the elasticsearch data source create earlier and after you should see a lot of data showing on the graph. This is the same data at kinana would show if it just counted entries. This one picks Data histogram and @timestamp as default. In the query field just add the search string as used in the kibana search but just in a the lucene query as syslog_messages:dnsbl and it will count the entries and show it in the graph. Just return to the dashboard when finish. NB, a alias can be giving to name the graph
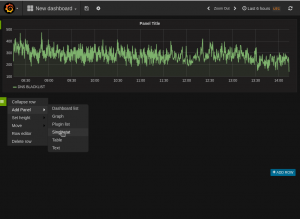
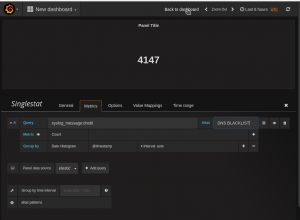
Singelitem panel
The procedure is the same as with the graph.. There is a lot of setting that can be added to these items after they are created. And can be used for alerting and status of a giving resource
I will take take customizing under treatment in a future post
Is that what is called grafana?
Yes in its really simpel form